
August 2023 U.S. Energy Use Intensity by Property Type Page 1
U.S. Energy Use Intensity by Property Type
Technical Reference
OVERVIEW
This reference table is designed to help you to compare your property’s energy use to the national median (or mid-
point) energy use of similar properties.
Benchmarking your Property
When benchmarking in Portfolio Manager, we recommend that you focus on the primary function (or, main activity) in
your building(s). Begin by selecting your primary function from the table below and then enter as few additional use
types as possible. Benchmarking your building using a single use type will most closely approximate how your
building would have been recorded in the reference data survey, and therefore yield the most accurate comparisons
to median performance. In some cases, buildings may have multiple distinctly different uses. For example, an office
and a hotel that share a common building. In these mixed-use settings, it is appropriate to enter multiple use types.
Definitions of all property types are available at: www.energystar.gov/PMGlossary
.
Using Median Site and Source Energy Use Intensity (EUI)
The national median source EUI is a recommended benchmark metric for all buildings. The median value is the
middle of the national population – half of buildings use more energy, half use less. The median works better than the
mean (arithmetic average) for comparing relative energy performance, because it more accurately reflects the mid-
point of energy use for most property types.
The table presents the median in both site EUI and source EUI. Site EUI is what you may be familiar with from your
utility bills. Site EUI contains a mixture of what is called primary energy (i.e., a raw fuel like natural gas) and
secondary energy (i.e., a converted product like electricity or district steam). Source energy provides the most
equitable way to combine primary and secondary energy types into a single common unit, ensuring that no building
receives either a credit or a penalty based on its energy source or utility. You can learn more about source energy
and the way it is computed at www.energystar.gov/SourceEnergy
. We strongly encourage you to use source EUI.
While almost all commercial building types have a national Median Source EUI, some (presented in cyan) will also
have a 1-100 ENERGY STAR Score. The score evaluates a building relative to its peers, similar to the median
energy use values, and also adjusts for climate and business activity. You can learn more about the score at:
www.energystar.gov/ENERGYSTARScore
.
Understanding Reference Data
The right-most column in the table indicates the reference data source we use to determine the median performance
of buildings in your peer group. To compute the national median, we always rely on nationally representative data.
For the majority of property types, the reference data is from the Commercial Building Energy Consumption Survey
(CBECS). This is a national survey conducted by the U.S. Department of Energy’s Energy Information Administration
(for more information visit: http://www.eia.gov/consumption/commercial/
). Three additional surveys are referenced for
data centers, wastewater treatment plants, and multifamily housing. Additional information on these surveys can be
found in the technical reference document for each property type.
August 2023 U.S. Energy Use Intensity by Property Type Page 2
Technical Reference
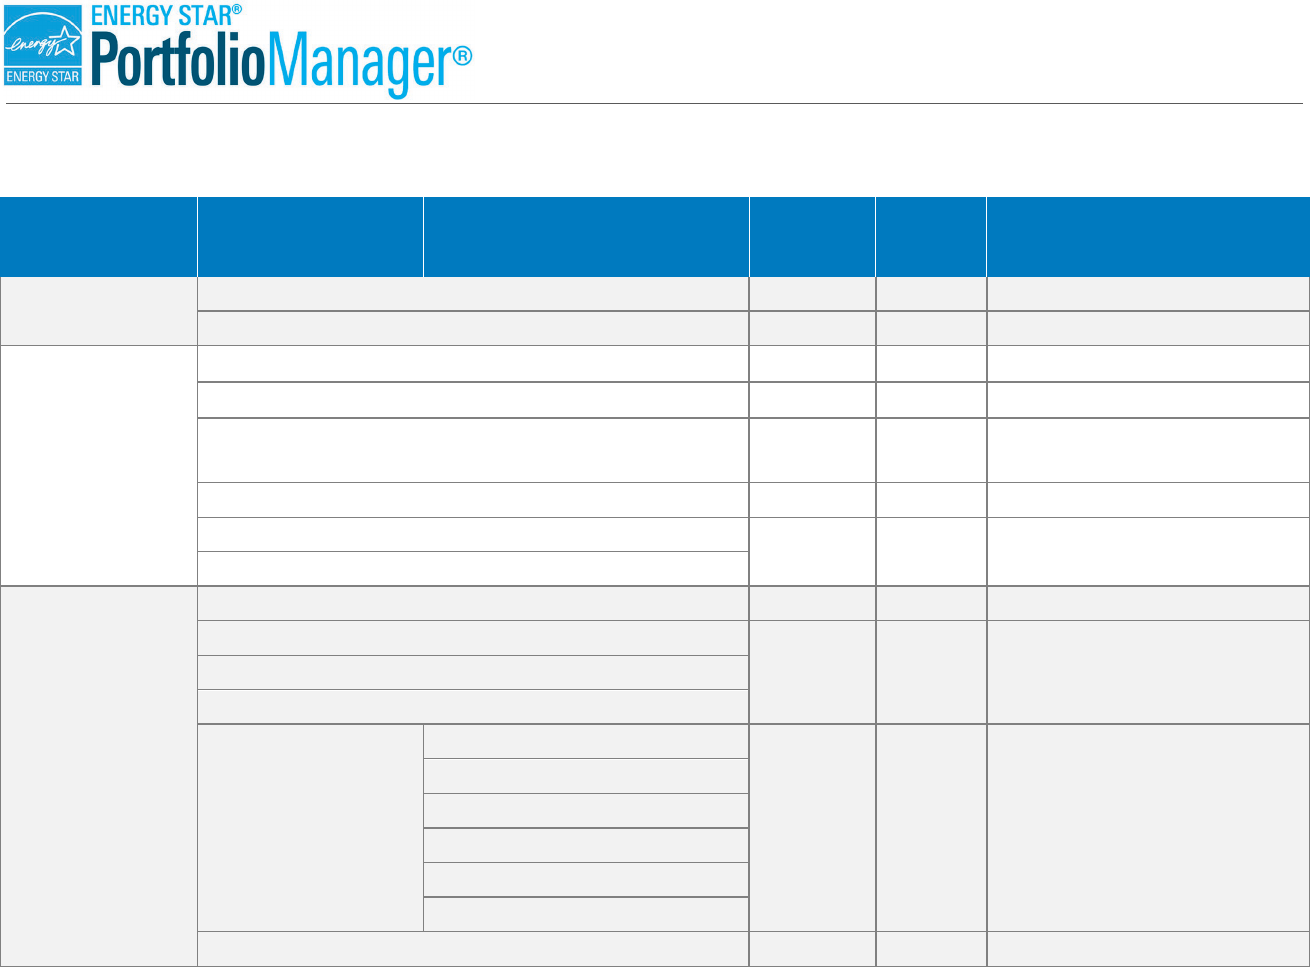
U.S. National Median Reference Values for All Portfolio Manager Property Types
Broad Category Primary Function
Further Breakdown
(where needed)
Source EUI
(kBtu/ft
2
)
Site EUI
(kBtu/ft
2
)
Reference Data Source -
Peer Group Comparison
Banking/Financial
Services
Bank Branch *
209.9 88.3 CBECS - Bank/Financial
Financial Office* 116.4 52.9 CBECS - Office & Bank/Financial
Education
Adult Education 110.4 52.4 CBECS - Education
College/University 180.6 84.3 CBECS - College/University
K-12 School* 104.4 48.5
CBECS - Elementary/Middle
& High School
Pre-school/Daycare 131.5 64.8 CBECS - Preschool
Vocational School
110.4 52.4 CBECS - Education
Other - Education
Entertainment/Public
Assembly
Convention Center 109.6 56.1 CBECS - Social/Meeting
Movie Theater
112.0 56.2 CBECS - Public Assembly Museum
Performing Arts
Recreation
Bowling Alley
112.0 50.8 CBECS - Recreation
Fitness Center/Health Club/Gym
Ice/Curling Rink
Roller Rink
Swimming Pool
Other - Recreation
Social/Meeting Hall 109.6 56.1 CBECS - Social/Meeting
August 2023 U.S. Energy Use Intensity by Property Type Page 3
Technical Reference
Broad Category Primary Function
Further Breakdown
(where needed)
Source EUI
(kBtu/ft
2
)
Site EUI
(kBtu/ft
2
)
Reference Data Source -
Peer Group Comparison
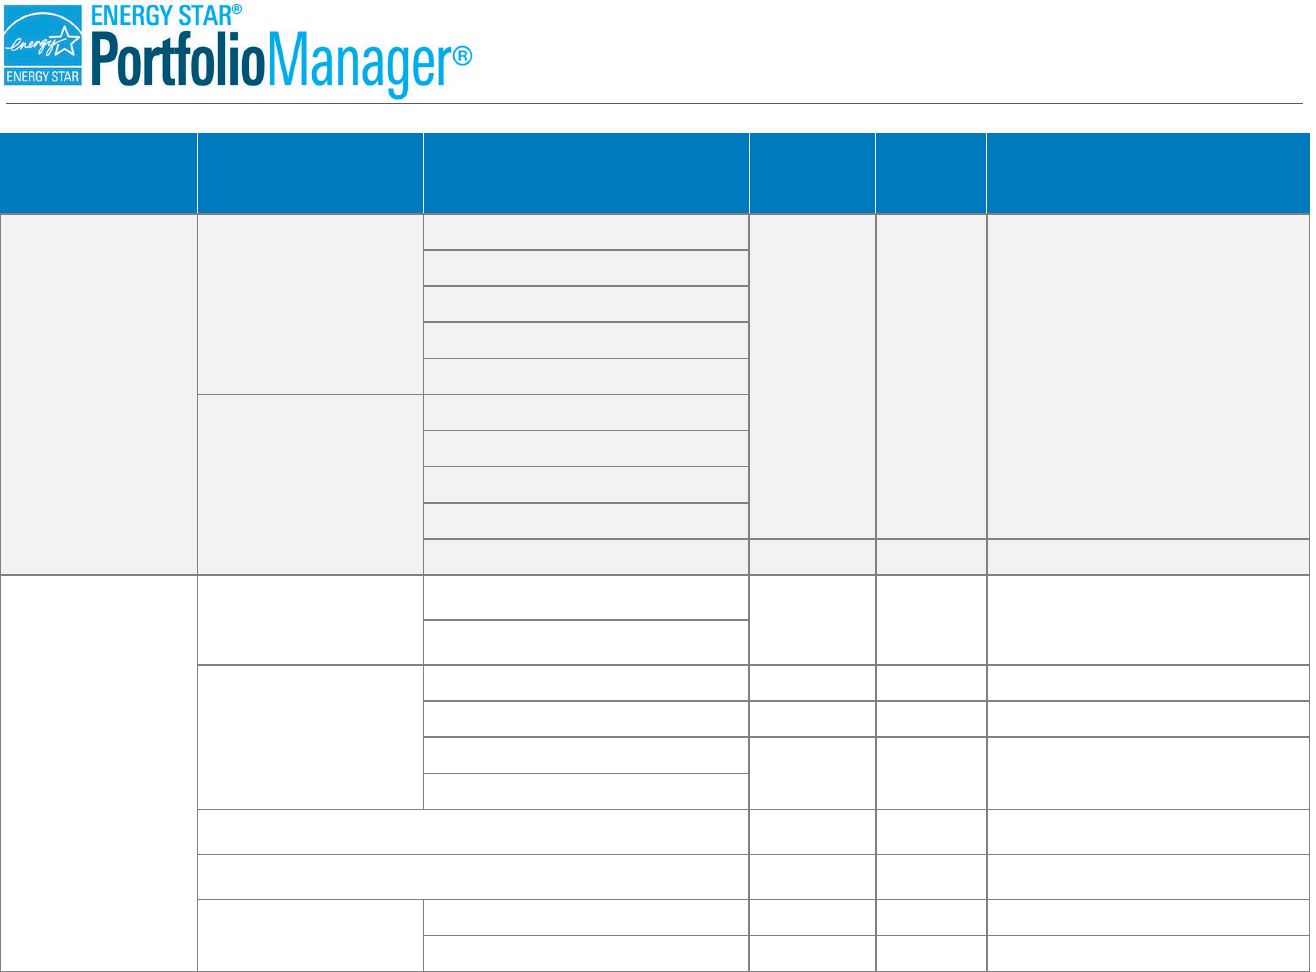
Entertainment/Public
Assembly
Stadium
Indoor Arena
112.0 56.2 CBECS - Public Assembly
Race Track
Stadium (Closed)
Stadium (Open)
Other - Stadium
Other
Aquarium
Casino
Zoo
Other - Entertainment/Public Assembly
Bar/Nightclub 297.0 130.7 CBECS - Bar/Pub/Lounge
Food Sales & Service
Convenience Store*
Convenience Store with Gas Station
883.5 350.9 Industry Survey
Convenience Store without Gas Station
Restaurant/Bar
Bar/Nightclub 297.0 130.7 CBECS - Bar/Pub/Lounge
Fast Food Restaurant 886.4 402.7 CBECS - Fast Food
Restaurant
573.7 325.6 CBECS - Restaurant/Cafeteria
Other - Restaurant/Bar
Supermarket/Grocery Store* 444.0 196.0 CBECS - Grocery Store/Food Market
Wholesale Club/Supercenter* 120.0 51.4 CBECS - Retail Store
Other
Food Sales 592.6 231.4 CBECS - Food Sales
Food Service 527.7 270.3 CBECS - Food Service
August 2023 U.S. Energy Use Intensity by Property Type Page 4
Technical Reference
Broad Category Primary Function
Further Breakdown
(where needed)
Source EUI
(kBtu/ft
2
)
Site EUI
(kBtu/ft
2
)
Reference Data Source -
Peer Group Comparison
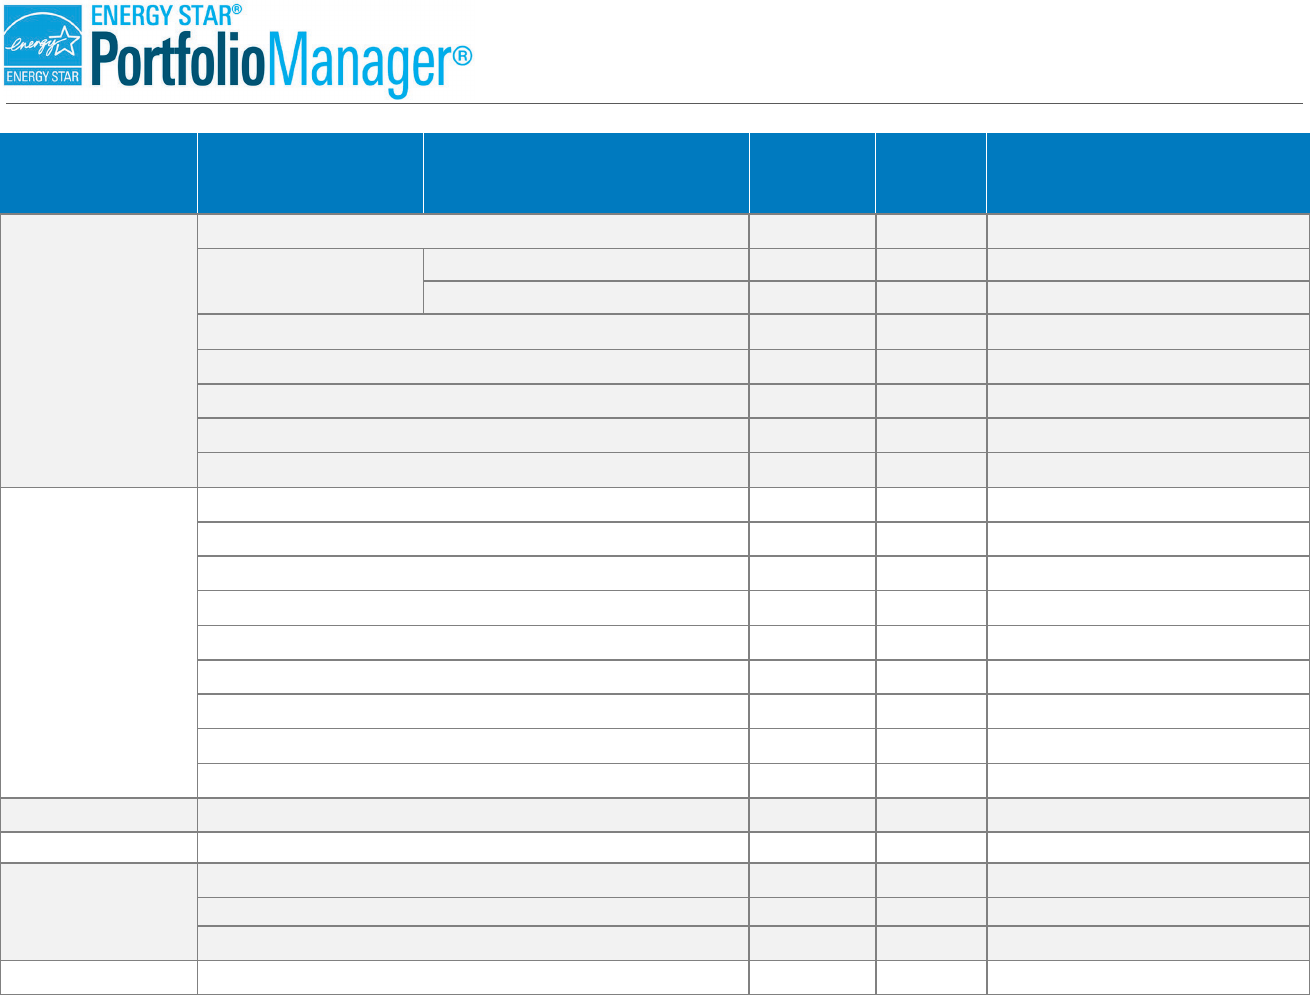
Healthcare
Ambulatory Surgical Center 138.3 62.0 CBECS - Outpatient Healthcare
Hospital
Hospital (General Medical & Surgical)*
426.9
234.3
Industry Survey
Other/Specialty Hospital
433.9
206.7
CBECS - Inpatient Healthcare
Medical Office* 232.8 97.8 Industry Survey
Outpatient Rehabilitation/Physical Therapy 138.3 62.0 CBECS - Outpatient Healthcare
Residential Care Facility 213.2 99.0 Industry Survey
Senior Living Community*
213.2
99.0
Industry Survey
Urgent Care/Clinic/Other Outpatient 145.8 64.5 CBECS - Clinic/Outpatient
Lodging/Residential
Barracks* 107.5 57.9 CBECS - Dormitory
Hotel* 146.7 63.0 CBECS - Hotel & Motel/Inn
Multifamily Housing*
118.1
59.6
Fannie Mae Industry Survey
Prison/Incarceration 156.4 69.9 CBECS - Public Order and Safety
Residence Hall/Dormitory* 107.5 57.9 CBECS - Dormitory
Residential Care Facility 213.2 99.0 Industry Survey
Senior Living Community*
213.2
99.0
Industry Survey
Single Family Home N/A N/A None Available
Other - Lodging/Residential 143.6 63.6 CBECS - Lodging
Manufacturing/Industrial Manufacturing/Industrial Plant N/A N/A None Available
Mixed Use
Mixed Use Property
89.3
40.1
CBECS - Other
Office
Medical Office* 121.7 51.2 CBECS - Medical Office
Office*
116.4
52.9
CBECS - Office & Bank/Financial
Veterinary Office 145.8 64.5 CBECS - Clinic/Outpatient
Parking Parking N/A N/A None Available
August 2023 U.S. Energy Use Intensity by Property Type Page 5
Technical Reference
Broad Category Primary Function
Further Breakdown
(where needed)
Source EUI
(kBtu/ft
2
)
Site EUI
(kBtu/ft
2
)
Reference Data Source -
Peer Group Comparison
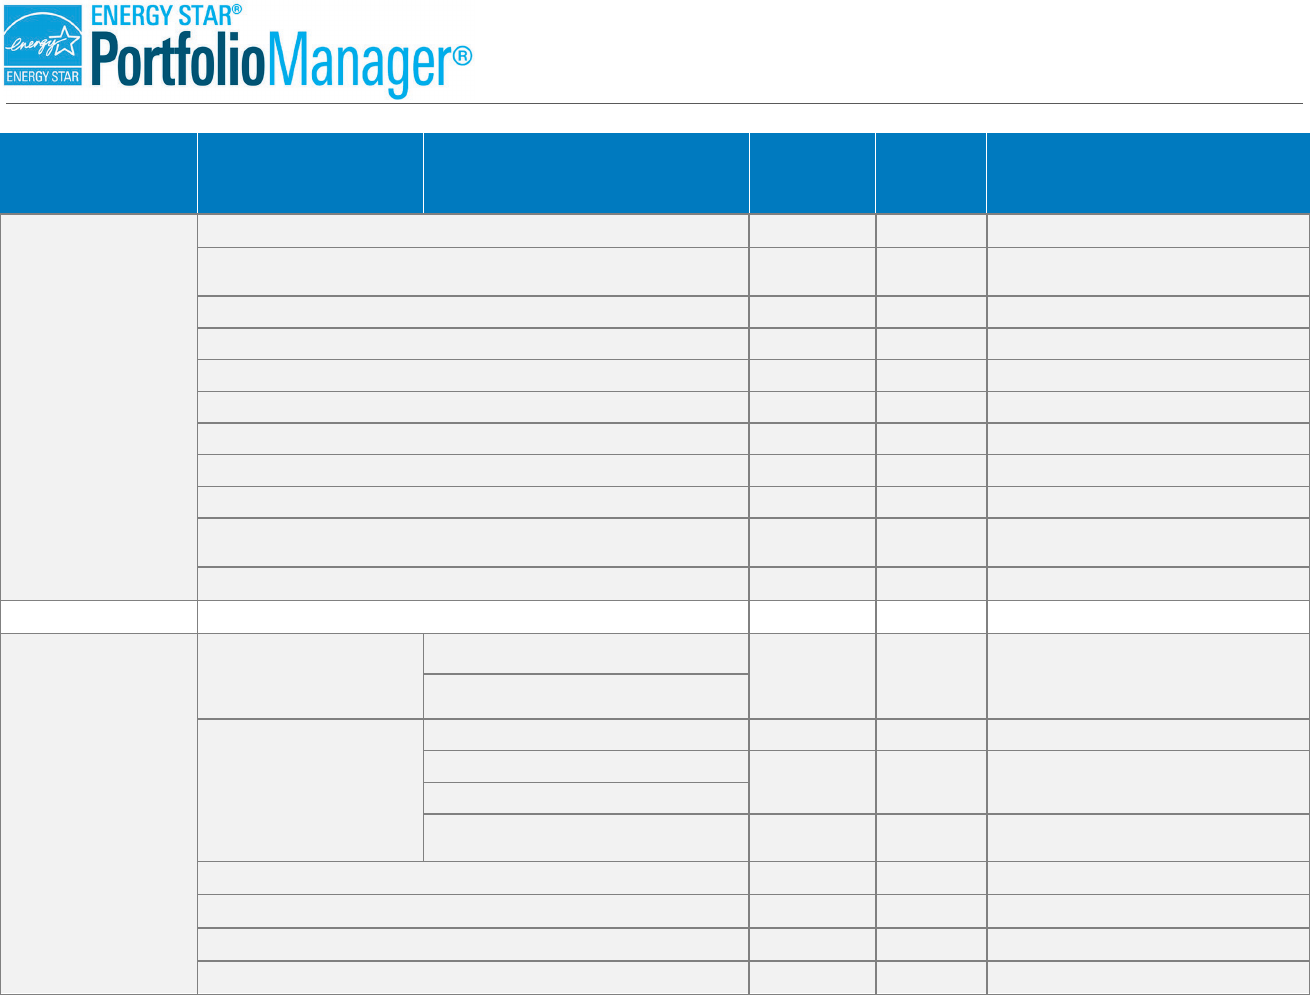
Public Services
Courthouse* 211.4 101.2 CBECS - Courthouse
Drinking Water Treatment & Distribution
(Average EUI presented in Energy per Flow in gallons per day)
5.90 2.27 AWWA - Water Treatment Plant
Fire Station 124.9 63.5 CBECS - Fire Station/Police Station
Library
143.6
71.6
CBECS - Library
Mailing Center/Post Office
96.9
47.9
CBECS - Service
Police Station
124.9
63.5
CBECS - Fire Station/Police Station
Prison/Incarceration
156.4
69.9
CBECS - Public Order and Safety
Social/Meeting Hall
109.6
56.1
CBECS - Social/Meeting
Transportation Terminal/Station
112.0
56.2
CBECS - Public Assembly
Wastewater Treatment Plant*
(Average EUI presented in Energy per Flow in gallons per day)
7.51
2.89 AWWA - Wastewater Plant
Other - Public Services 89.3 40.1 CBECS - Other
Religious Worship
Worship Facility*
58.4
30.5
CBECS - Religious Worship
Retail
Convenience Store*
Convenience Store with Gas Station
883.5 350.9 Industry Survey
Convenience Store without Gas Station
Mall
Enclosed Mall
170.7
65.7
CBECS - Enclosed Mall
Lifestyle Center
228.8 103.5 CBECS - Strip Shopping Mall
Strip Mall
Other - Mall 225.3 101.6
CBECS - Enclosed Mall and
Strip Shopping Mall
Retail Store* 120.0 51.4 CBECS - Retail Store
Supermarket/Grocery Store*
444.0
196.0
CBECS - Grocery Store/Food Market
Vehicle Dealership* 138.2 71.9 Industry Survey
Wholesale Club/Supercenter*
120.0 51.4 CBECS - Retail Store
August 2023 U.S. Energy Use Intensity by Property Type Page 6
Technical Reference
Broad Category Primary Function
Further Breakdown
(where needed)
Source EUI
(kBtu/ft
2
)
Site EUI
(kBtu/ft
2
)
Reference Data Source -
Peer Group Comparison
Technology/Science
Data Center*
(Average PUE presented in place of EUI:
PUE = Total Energy / IT Energy)
1.82 1.82 EPA - Data Center
Laboratory 318.2 115.3 CBECS - Laboratory
Other – Technology/Science 89.3 40.1 CBECS - Other
Services
Data Center*
(Average PUE presented in place of EUI:
PUE = Total Energy / IT Energy)
1.82 1.82 EPA - Data Center
Personal Services (Health/Beauty, Dry Cleaning, etc.)
96.9 47.9 CBECS - Service Repair Services (Vehicle, Shoe, Locksmith, etc.)
Other - Services
Utility
Drinking Water Treatment & Distribution
(Average EUI presented in Energy per Flow in gallons per day)
5.90 2.27 AWWA - Water Treatment Plant
Energy/Power Station 89.3 40.1 CBECS - Other
Wastewater Treatment Plant*
(Average EUI presented in Energy per Flow in gallons per day)
7.51 2.89 AWWA - Wastewater Plant
Other - Utility 89.3 40.1 CBECS - Other
Warehouse/Storage
Self-Storage Facility 47.8 20.2 CBECS – Non-refrigerated Warehouse
Warehouse/Distribution
Center
Distribution Center*
52.9 22.7
CBECS – Non-refrigerated Warehouse
& Distribution Center
Non-Refrigerated Warehouse*
Refrigerated Warehouse* 235.6 84.1 CBECS – Refrigerated Warehouses
Other Other 89.3 40.1 CBECS - Other
