--
NASA
TN
D-4650
e,
1
0
--I
rh
"
-0
a=
COMPILATION OF THERMOPHYSICAL
PROPERTIES
OF
LIQUID
LITHIUM
by
Harry
W.
Dauison
Lewis Research Center
Cleveland,
Ohio
..
x
NATIONAL AERONAUTICS AND SPACE ADMINISTRATION WASHINGTON, D.
C.
JULY
1968
/
6
TECH
LIBRARY
KAFB,
NM
-a
I111111
11111
lllll
lllll1ll11
IIIII
11111
1111
1111
0231371
COMPILATION
OF
THERMOPHYSICAL PROPERTIES
OF
LIQUID LITHIUM
By Harry
W.
Davison
Lewis Research Center
Cleveland, Ohio
NATIONAL AERONAUT ICs AND SPACE ADM IN
I
STRATION
For sale
by
the Clearinghouse for Federal Scientific and Technic01 Information
Springfield, Virginia
22151
-
CFSTI
price
$3.00
,I
ABSTRACT
A
compilation
of
properties including density, electrical resistivity, enthalpy, heat
capacity, surface tension, thermal conductivity, vapor pressure, viscosity, Prandtl
number, and thermal diffusivity
is
presented for temperatures between the melting point
and normal boiling point of lithium. Empirical correlations were obtained by statisti-
cally fitting
a
polynomial to experimental data obtained from the literature.
STAR
Category
17
ii
COMPILATION
OF
THERMOPHYSICAL PROPERTIES
OF
LIQUID LITHIUM
by
Harry
W.
Davison
Lewis Research Center
SUMMARY
Liquid lithium
is
a
potential coolant candidate for use in high-temperature nuclear
space power systems.
It
is
desirable, based on thermodynamic considerations, to
raise
the lithium temperature
as
close to the normal boiling point
as
possible. Thermophysical
property data for liquid lithium
at
temperatures approaching the normal boiling point
are
scarce,
and some
of
the data are in disagreement. Empirical correlations relating den-
sity, electrical resistivity, enthalpy, heat capacity, surface tension, thermal conduc-
tivity, vapor pressure, viscosity, Prandtl number, and thermal diffusivity with tempera-
ture have been developed.
These correlations, developed from experimental data ob-
tained from the technical literature, were extrapolated to about 1600 K.
The normal boiling point, calculated from the vapor pressure correlation
is
1608rt6 K.
The thermal conductivity predicted from
a
modified Ewing, et
al.,
correla-
tion suggests
a
maximum thermal conductivity of about
65
watts per meter-K
at
1500
K.
The latent heat
of
fusion calculated from the enthalpy correlations
is
4.
55x10
5
joules per
kilogram.
INTRODUCTION
Reactor designers
are
considering liquid lithium
as
a
possible coolant for space
power systems
(ref.
1).
Such systems require high operating temperatures to minimize
the system size and weight and
to
ensure
best
operating efficiencies. Lithium has sev-
eral
desirable features
for
high-temperature applications such
as
low vapor pressure,
low density, high heat capacity, and low pumping power requirements.
If
space power
systems utilizing liquid lithium
as
a
coolant
are
to be designed to obtain maximum per-
formance,
it
is
necessary to compile the physical properties
of
liquid lithium which
will
be
required by the designer.
A
considerable amount of experimental data for lithium
is
available in the literature for temperatures between the melting point and about
1000
K.
For
space power system application,
it
is
desirable
to
obtain data up to the normal boil-
ing point (about
1600
K)
to
increase the flexibility of system designs. Therefore,
it
is
necessary to either perform experiments
or
extrapolate present data. Some of the pres-
ent results, however,
are
conflicting, such
as
those for heat capacity and thermal con-
ductivity.
The purpose of
this
report
is
to correlate the thermophysical properties of saturated
liquid lithium
as
a
function of temperature, using both experimental data and theoretical
analyses; and based upon these correlations extrapolate the properties to about
1600
K.
The general method of correlating the data with temperature
is
described
first.
This
is
followed by
a
discussion of the experimental method, correlating equation, and stan-
dard and maximum deviation between the correlation and the data for each property. A
list
of references and
a
bibliography are included. All of the sources
of
the experimental
data used to develop the empirical correlations
are
presented in the references. Other
sources of work of interest
are
presented in the bibliography.
C
P
H
H2
73
AHf
k
M
P
Pr
R
T
a!
P
P
0
SYMBOLS
heat capacity, J/(kg)(K)
enthalpy, J/kg
enthalpy
at
273
K,
J/kg
latent heat of fusiv-+ J/kg
thermal conductivity, W/(m)(K)
molecular weight, g
vapor pressure, N/m
2
Prandtl number
electrical resistivity, (pQ)(cm)
absolute temperature, K
thermal diffusivity, m
2
/sec
viscosity, (N)(sec)/m
2
density, kg/m
3
surface tension, N/m
Subscript:
S
solid
2
CORRELATION
OF
LITHIUM PROPERTY DATA
Met
hod
of
Cor
r
e
I
a
t
io
n
The experimental data on the properties of liquid lithium were obtained from
a
lit-
erature review.
These data
were
empirically correlated
as
a
function of temperature.
Generally, the properties were correlated using the following relation:
where
p
is
either the property of interest
or
the logarithm of the property,
T
is
the
temperature, and Ai are the constant coefficients. The degree of the polynomial was
selected (by
trial
and error) to yield the best correlation.
The best correlation
is
the
one which yields
a
coefficient of correlation closest to
1.0.
In cases where there
is
little
difference between correlating equations, the polynomial of lowest degree
is
se-
lected.
To facilitate calculations only polynomials of fourth degree and lower were in-
vestigated.
DISCUSSION
OF
PROPERTIES
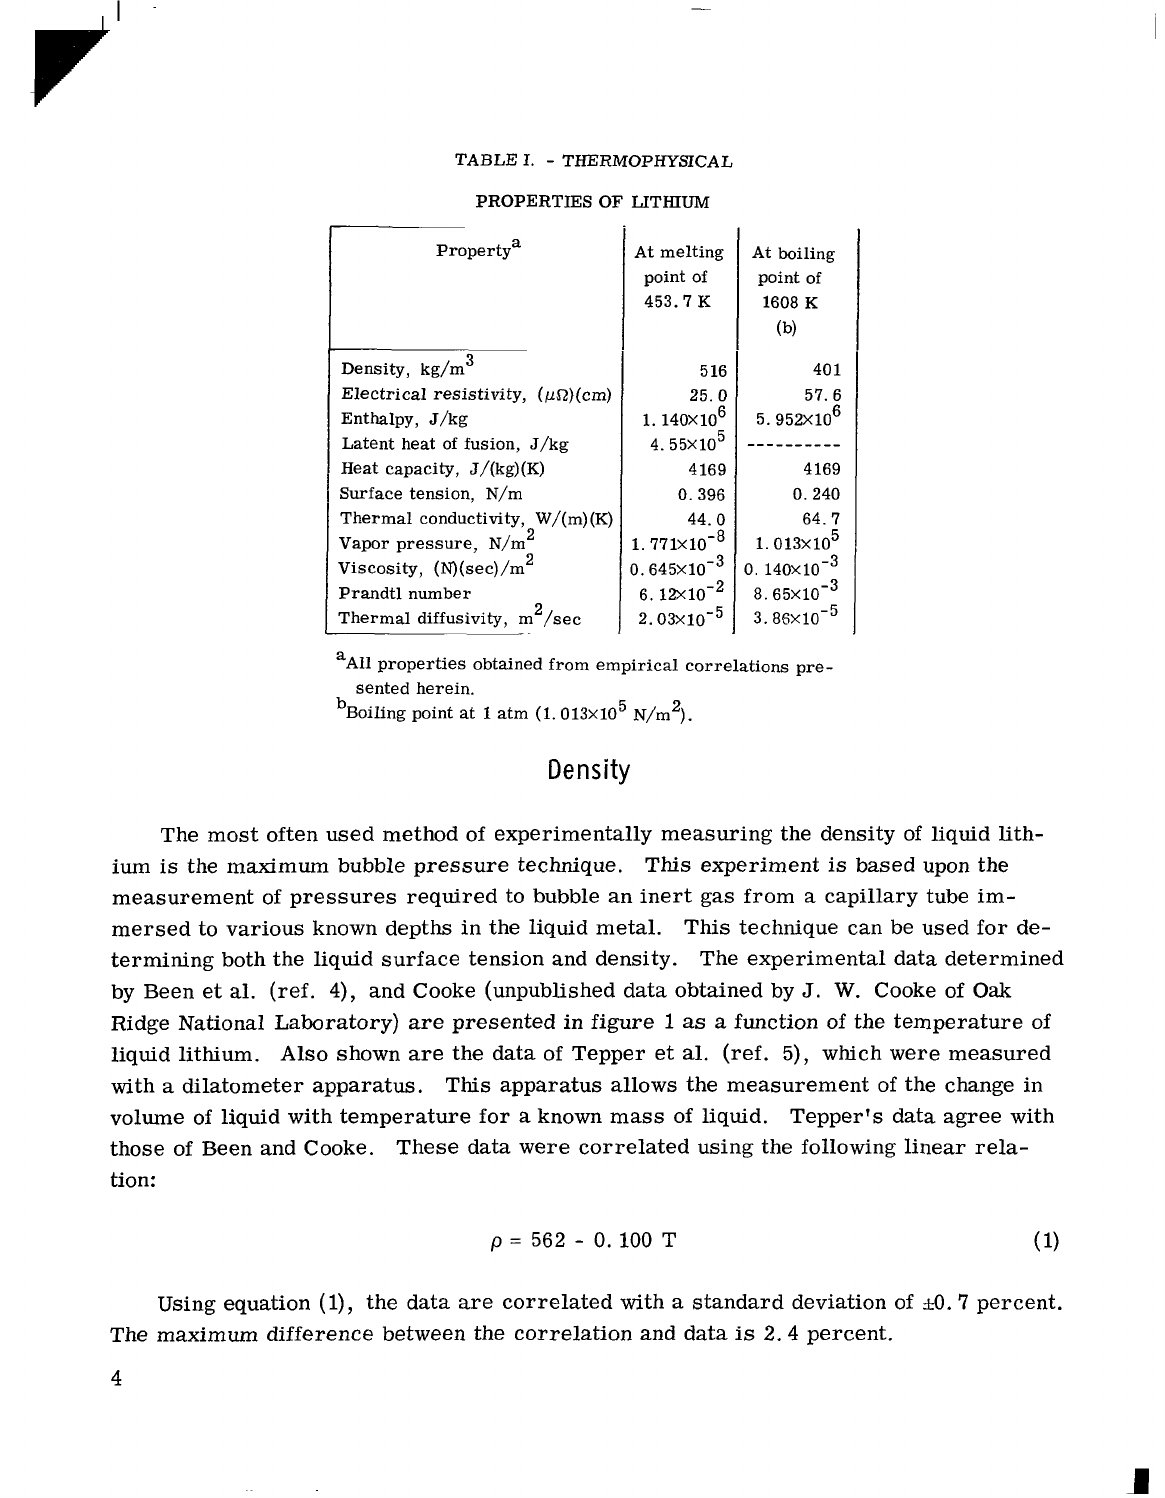
The properties of liquid lithium
at
the melting point and boiling point are summa-
rized in table
I.
These properties were obtained from the empirical correlations de-
rived herein. The properties of the saturated liquid are plotted in figures
l
to
ll
as
a
function of temperature.
All
of the empirical correlations, shown
as
solid curves, are
derived from experimental measurement. The heat capacity data and the thermal con-
ductivity data exhibited considerable scatter. Therefore, heat capacity
was
calculated
using the enthalpy correlation, and thermal conductivity was calculated using
a
modified
version of the correlation proposed by Ewing et
al.
(ref.
2).
Prandtl number and ther-
mal diffusivity are defined functions of the liquid lithium properties. The viscosity data
of Novikov
et
al.
(ref.
3),
were obtained from
a
technical translation of
work
done in the
U.
S.
S.
R.
There
are
no tabulations of the experimental data, only graphs.
These data
were obtained by interpolation from the graphs.
3
----------
TABLE
I.
-
THERMOPHYSICAL
PROPERTIES
OF
LITHIUM
At melting
De
11s
ity
,
kg/m
3
Electrical resistivity, (pQ)(cm)
Enthalpy, J/kg
Latent heat of fusion, J/kg
Heat capacity, J/(kg)(K)
Surface tension, N/m
Thermal conductivity, W/(m)(K)
Vapor pressure, N/m
2
point of
453.7
K
5
16
25.
0
1.
14OX1O6
At boiling
point
of
1608
K
(b)
40
1
57. 6
5. 952X106
4.55~10~
4169
4169
0.396
0.240
44.0
64.7
1.
771X10-8
1.013~10~
viscosity,
(N)
(sec)/m
2
).645x10-~
D.
140~10-~
Prandtl number
6. 12X10-2
8.65~10-~
Thermal diffusivity, m
2
/sec
2.03x10-~
3. 86X10-5
~.
aAll properties obtained from empirical correlations pre-
sented herein.
..
bBoiling point
at
1
atm
(1.013x10 5
N/m
2
).
Density
The most often used method of experimentally measuring the density of liquid lith-
ium
is
the maximum bubble pressure technique. This experiment
is
based upon the
measurement of pressures required to bubble an inert gas from
a
capillary tube im-
mersed to various known depths in the liquid metal.
This technique can be used for de-
termining both the liquid surface tension and density.
The experimental data determined
by Been et
al.
(ref.
4),
and Cooke (unpublished data obtained by
J.
W.
Cooke
of
Oak
Ridge National Laboratory)
are
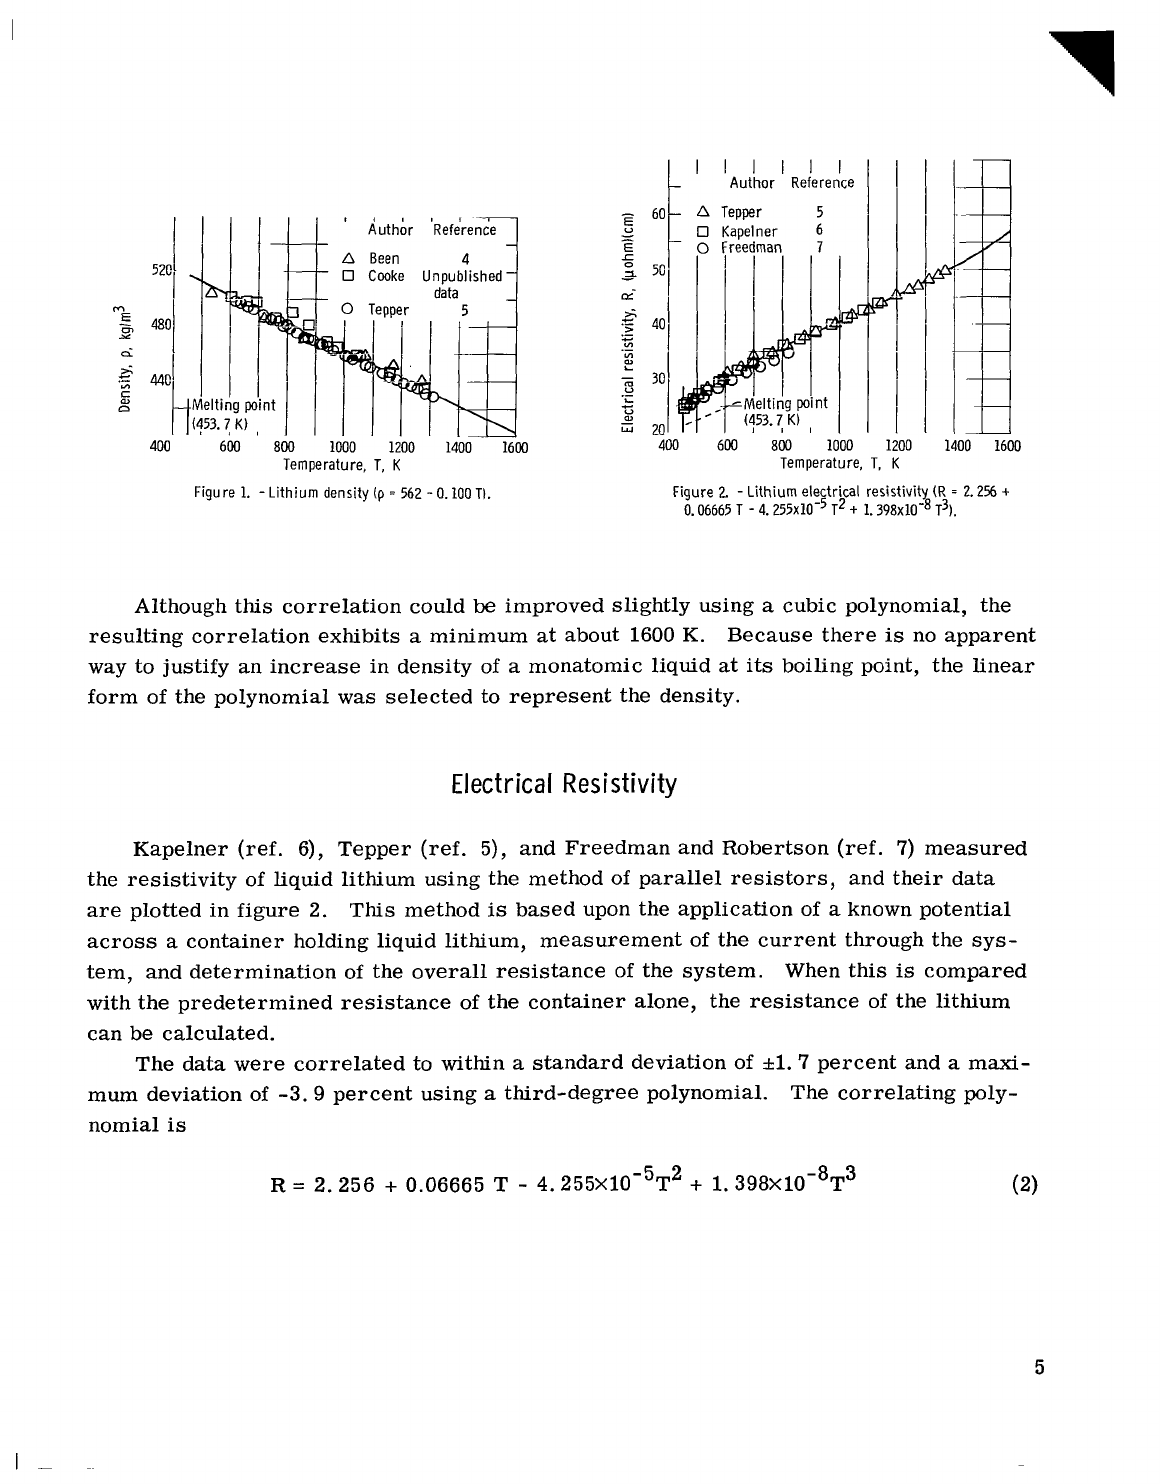
presented in figure
1
as
a
function of the temperature of
liquid lithium. Also shown are the data of Tepper et
al.
(ref.
5),
which were measured
with
a
dilatometer apparatus. This apparatus allows the measurement
of
the change in
volume of liquid with temperature for
a
known mass of liquid. Tepper's data agree with
those of Been and Cooke. These data were correlated using the following linear rela-
tion:
p
=
562
-
0.
100
T
(
1)
Using equation
(1)
,
the data are correlated with
a
standard deviation of
SO.
7
percent.
The maximum difference between the correlation and data
is
2.4
percent.
4
I I I I I I
Author Reference
0
Cmke Unpublished
B
I
400 6M1
800
1000
1200 1400 1600
Temperature, T,
K
Temperature, T,
K
Figure
1.
-
Lithium density
(p
=
562
-
0.100
TI.
Figure
2.
-
Lithium electrical resistivity
(R
=
2.256
+
0.06665 T
-
4.255~10-~ T31.T2
+
1.398~10-~
Although this correlation could
be
improved slightly using
a
cubic polynomial, the
resulting correlation exhibits
a
minimum
at
about 1600
K.
Because there
is
no apparent
way to justify an increase in density of
a
monatomic liquid
at
its
boiling point, the Linear
form of the polynomial was selected to represent the density.
Electrical Resistivity
Kapelner (ref. 6), Tepper
(ref.
5), and Freedman and Robertson (ref. 7) measured
the resistivity of Liquid lithium using the method of parallel resistors, and their data
are plotted in figure
2.
This
method
is
based upon the application of
a
known potential
across
a
container holding liquid lithium, measurement of the current through the sys-
tem, and determination of the overall resistance
of
the system. When this
is
compared
with the predetermined resistance of the container alone, the resistance of the lithium
can be calculated.
The data were correlated to within
a
standard deviation of
&l.
7
percent and
a
maxi-
mum deviation of
-3.9
percent using
a
third-degree polynomial.
The correlating poly-
nomial
is
R
=
2.256
+
0.06665
T
-
4.255X10
-5
T
2
+
1.398X10
-8
T
3
5

~ ~
F-
c
E
nt
ha
I
py
The enthalpy of liquid lithium
was
measured by Douglas
et
al.
(ref.
8),
Bates and
Smith (ref.
9),
Cabbage
(ref.
lo),
and Achener and Fisher
(ref.
11)
using the drop
method. The lithium
is
encapsulated, heated to
a
known
temperature, and dropped into
an ice calorimeter. The heat evolved from the capsule
is
measured.
The same experi-
ment
is
done with an empty capsule, and the enthalpy of the lithium
is
calculated
from
the difference between the values of the heat evolved.
t
~
Author Refer-
c
Capsule material
: - ~
0
Douglas
8
347 stainless steel
0
Bates 9 316 stainless steel
A
Cabbage
10
Iron
6x10⁶d Cabbage
10
321 stainless steel
1
0
Achener
11
Columbium
-
1
percent
5
(51
5
4-
m
N
I
1 3
I
s
a
-
E 2
w
1
0
200
400
600
800
1000
1200
1400
1600
Temperature,
T,
K
Figure 3. -Lithium enthalpy relative
to
273
K
(H
-
HZ73
=
-7.519~10~
+
4169
T).
The enthalpy data of Douglas, Bates, and Achener
were
presented relative to 273
K,
but Cabbage presented
his
data relative to
298
K.
The enthalpy change shown
in
figure 3
is
relative to the enthalpy of solid lithium
at
273
K.
Cabbage's data have been corrected
to 273
K
by linear extrapolation.
The enthalpy data presented in figure 3 were correlated using
a
linear equation in
temperature:
H
-
H273
=
-7. 519X105
+
4169T
(3)
6
The data of Cabbage were not included in this correlation because of the considerable
scatter compared to that of the other experimenters. Equation (3) correlates the data
with
a
standard deviation of
&l.
6 percent and
a
maximum deviation of -5.8 percent when
Cabbage's data
are
excluded. Although
a
cubic polynomial correlates the data slightly
better than the linear equation, the linear equation
is
recommended because of
its
sim-
pler form.
Douglas and Achener also presented enthalpy data for solid lithium. These data were
correlated with
a
standard deviation of k3.6 percent and
a
maximum deviation of -6.
5
percent.
Hs
-
H273
=
-1.
03X106
+
3780T
(4)
Latent Heat
of
Fusion
The latent heat of fusion was calculated by substracting liquid and solid enthalpies
at
the melting point obtained from equations
(3)
and
(4).
The latent heat of fusion
is
This value
is
about
6
percent higher than the values quoted by Douglas and Achener.
Heat
Capacity
The heat capacity of liquid lithium
has
been determined by several experimenters.
Bates (ref.
9)
and Cabbage (ref. 10) measured enthalpies of liquid lithium using the "drop
method'' described earlier.
They calculated mean heat capacities by dividing the meas-
ured enthalpy by the temperature interval. Douglas
(ref.
8)
and Achener (ref.
11)
em-
pirically correlated enthalpy data and calculated the heat capacity by taking the
first
de-
rivative of the enthalpy with respect to temperature. Kutateladze
et
al.
(ref.
12),
pre-
sent correlated results of heat capacity experiments.
The data were measured by the
method of direct heating of the sample. This method allows the sample to be heated in-
ternally while the environment
is
held
at
some known temperature. The total internal
heat input and temperature rise of the molten metal
are
measured, and the heat capacity
of the liquid
is
calculated.
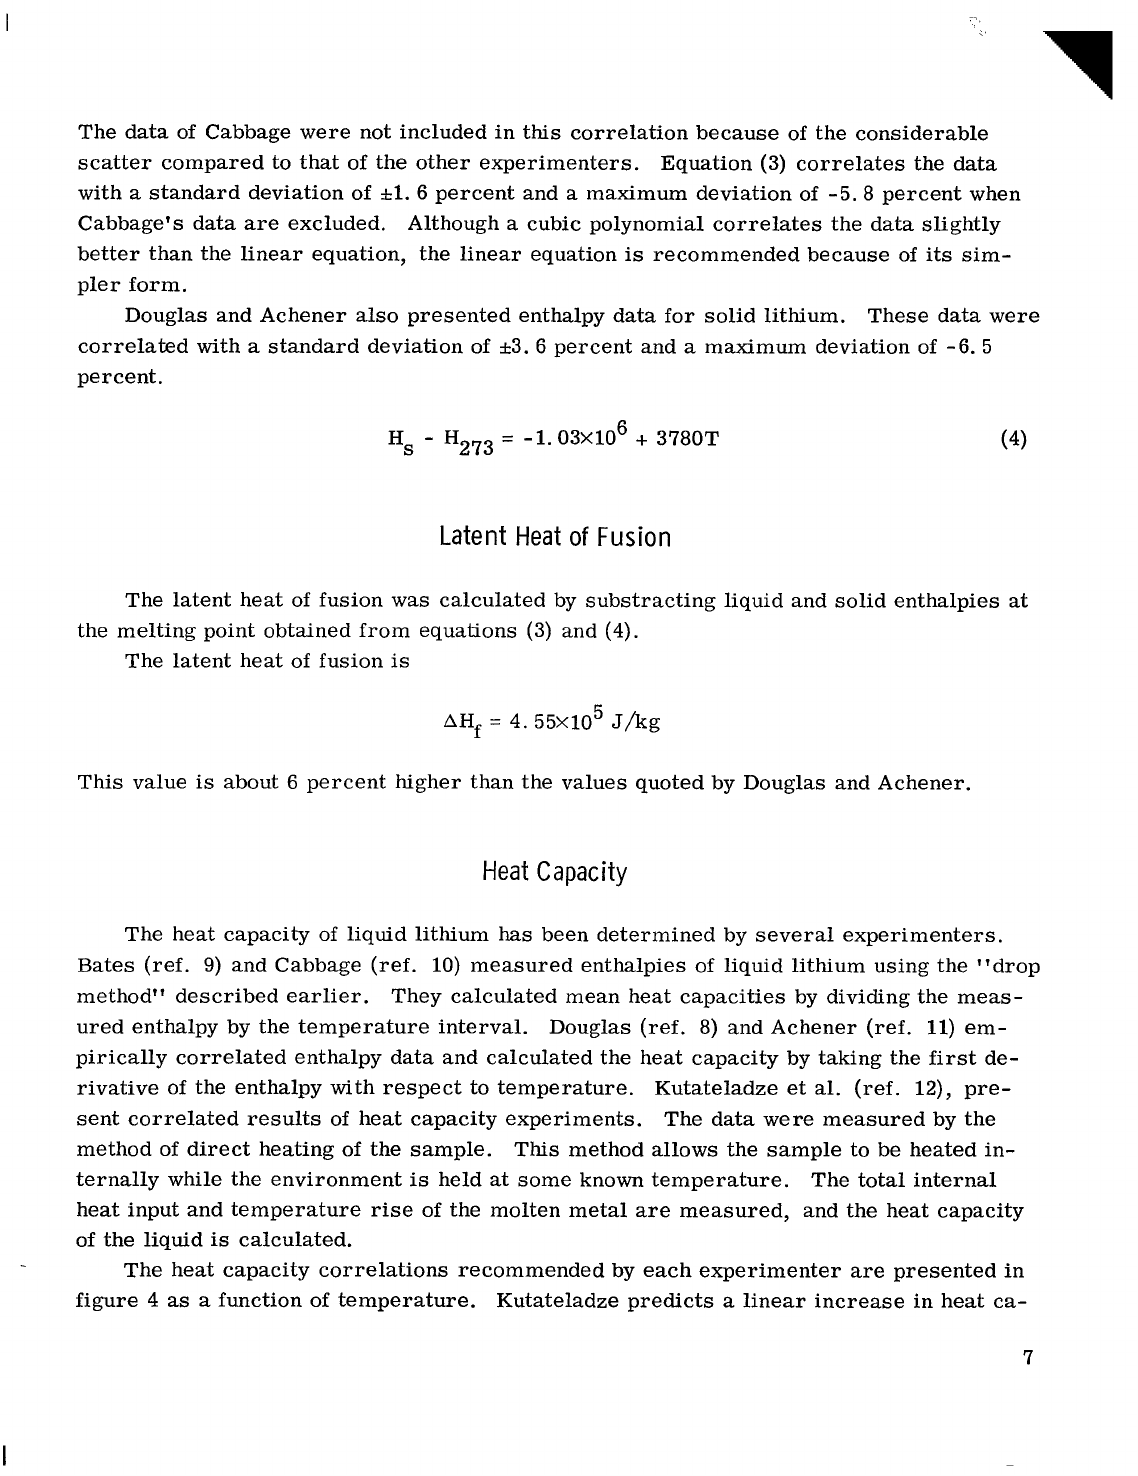
The heat capacity correlations recommended by each experimenter
are
presented in
figure
4
as
a
function of temperature. Kutateladze predicts
a
linear increase in heat ca-
7
I
5
I I I I I
6owm
I
Heat
capacity,
I
cp
I I
1
Curve
5600
-
Y
5200
7
b
U
s
4800
u
5
CL
u
4400
al
I
4000
3600
400
600
800
1000
1200
1400 1600
Temperature,
T,
K
Figure
4.
-
Lithium heat capacity.
pacity with temperature. Douglas and Cabbage predict linearly decreasing heat capacity
with temperature, and Achener predicts
a
quadratic relation between heat capacity and
temperature. Achener predicts
a
minimum heat capacity occurring
at
about 1150
K.
The
mean heat capacity value of
4020
joules per kilogram-K predicted by Bates
is
also shown.
The results of Cabbage
are
considerably higher in the low-temperature range than
the results of the other investigators. However,
as
indicated in figure
3,
there
is
con-
siderable scatter in the enthalpy data
of
Cabbage. Therefore, Cabbage's data were not
included in the calculation of the heat capacity of liquid lithium.
The empirical correlation for heat capacity
is
calculated by taking the temperature
derivative of the empirical correlation for enthalpy given by equation
(3).
The corresponding heat capacity, shown
as
curve
1
in figure
4,
is
c
P
=
4169 J/(kg)(K)
(5)
When an empirical correlation for enthalpy
is
differentiated to determine the heat
capacity, the extrapolated value of the heat capacity
is
affected by the degree of the en-
thalpy correlation.
Three solid curves
are
presented in
figure
4
representing linear
(curve
l),
quadratic (curve
2),
and cubic (curve
3)
enthalpy correlations. The tempera-
ture derivative of these correlations yields constant (temperature independent) linear and
quadratic correlations, respectively, for heat capacity.
Although the maximum differ-
ence between the enthalpy correlations
at
1600
K
is
1.7 percent, the maximum difference
between heat capacity correlations
at
1600
K
is
11
percent.
8
.
.
-...-
I....
.
..
..-._.
..
.
.
.I"

1
1
1000
1200
1400
1600
Achener
I I I
Surface Tension
Cooke (unpublished data), Achener
(ref.
13),
and Taylo; (ref.
14)
measured the sur-
face tension of liquid lithium in the temperature range from
460
K
to about
1300
K
using
the maximum bubble pressure method described earlier (in the section Density). These
data
are
plotted in figure
5.
The data were correlated using the following second-degree
polynomial in temperature
:
0
=
0.447
-
1.
OMO-~T
-
1.351X10
-8
T
2
(6)
Using equation
(6),
the data
are
correlated with
a
standard deviation of
kl.9
percent.
The maximum difference between the data and the correlation
is
+5.2
percent.
1 I I I
Author Refkrence
0
Cooke Unpublished
4
0
Taylor
dat'Ig
I
r,.,lting point
400 600
I
1
1000
1200
1400
1600
Temperature,
T,
K
Figure
5.
-
Lithium surface tension
(u
=
0.447
-
1.07~10-~T
1.
35x10-8T2).
-
Thermal Conductivity
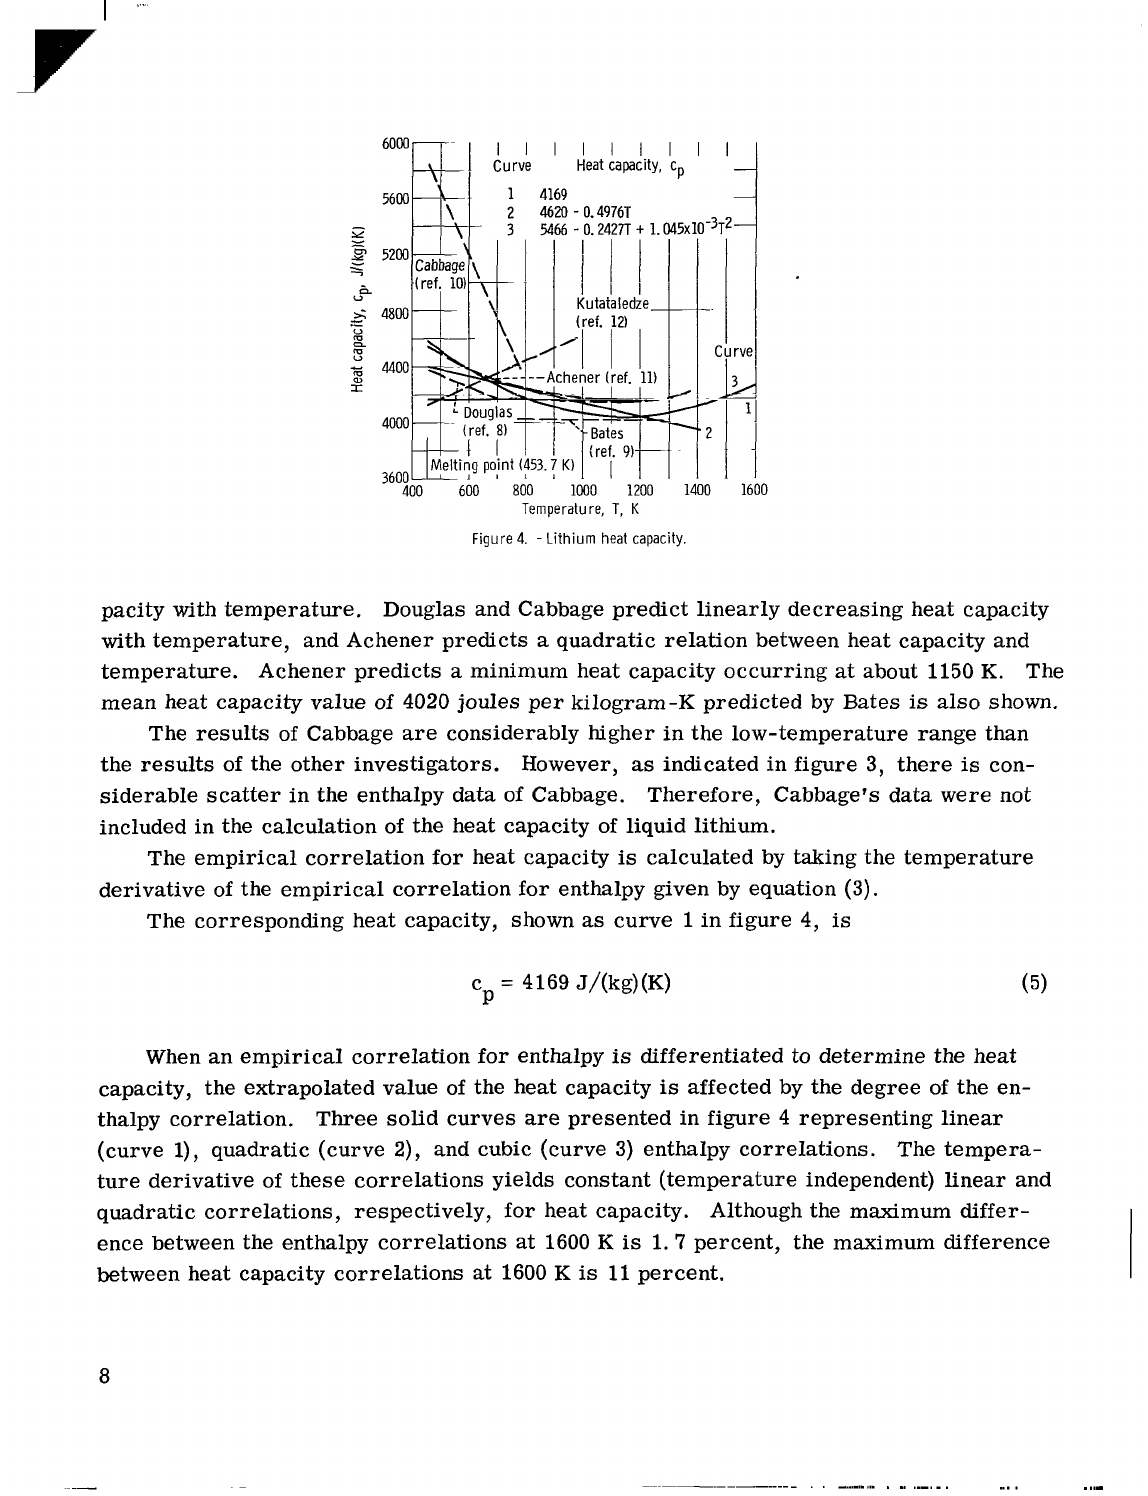
The thermal conductivity of lithium was measured by Webber et
al.
(ref.
15),
Cooke
(ref.
16),
and Nikolskii (ref,
17),
and the results
are
plotted in figure
6
for
various
temperatures.
Webber
and Cooke determined the conductivity by measuring the tem-
perature gradient in
a
molten column of lithium subjected to
a
known heat flow. Nikolskii
measured the thermal conductivity by the method of l"xcessive stationary
states.
"
This method
is
similar to
that
used by Cooke and Webber but no heaters
are
used to com-
pensate for
radial
heat losses.
The data of Cooke and those of Nikolskii
all
indicate that the thermal conductivity in-
9
--
---
---
80
Reference
01
Author
0
Webber
15
60
A
Cooke
16
.--.
50
d
;
d
0
I
Cooke
16
s
I
E
likolskii
-
I
J
0
It
I
1
800
1
1
I
1400 1600
1800
2000
2200
Temperature, T,
I(
Figure 6.
-
Lithium thermal conductivity.
/
i
e
/
2
ence
A
Cooke
16
0
Cooke 16
+I
I I i i l l
Cooke 16
Ewincl
2
IP
<'
I
400
I
800
1000
1200
1400
1600 1800
2000
IO
Temperature,
T,
K
Figure
7.
-
Lithium thermal conductivity.
creases
with temperature, while the data of Webber show
a
reduction in conductivity with
increasing temperature. Cooke (ref.
16)
suggests that Webber's data
are
in disagree-
ment with those of other experimenters because of contamination
of
the lithium with iron
from the sample container and with cement which was used
as
an electrical insulator.
Cooke also suggests that the large scatter in the data of Nikolskii
(40
percent of the data
deviate from the mean by more than
*5
percent) may
be
due to contamination of the lith-
ium and radial heat losses. Therefore, the data of Cooke were assumed to
be
most
re-
liable
experimental data available.
10

The thermal conductivity of metals can also be calculated
as
a
function of tempera-
ture,
electrical resistivity, heat capacity, and density using the relation proposed by
Ewing
(ref.
2):
c P2
k
=
2.61
-
T
-
8.37XlO
-
+
2.31X10⁻⁶
R
MT
pcP
The empirical correlations between temperature and electrical resistivity (eq. (2)),
density (eq.
(l)),
and heat capacity (eq. (5)) were used to calculate thermal conductivity
as
a
function of temperature.
The thermal conductivity calculated from equation
(7)
is
plotted in figure 7
as
a
function of temperature.
The data of Cooke and Cooke's proposed
empirical correlation between thermal conductivity and temperature
are
also shown in
figure
7.
The conductivity based on .Ewing's correlation
are
consistently higher than the
data of Cooke. The standard deviation between Ewing's correlation and Cooke's
data
is
12 percent. The coefficient used in the
first
term of Ewing's correlation
is,
however,
about
7
percent higher than the value which was derived by Sommerfeld (ref.
18).
Sommerfeld's coefficient
was
used in the correlation of Ewing to yield the following:
c
P2
k
=
2.45
-
T
-
8.37~10
-
+
2.31X10⁻⁶p
R
MT
pcP
The thermal conductivity calculated using
this
correlation and empirical correlations for
R,
p, and c
P'
is
also shown in figure
7.
The standard deviation between Cooke's data
and the predictions of
this
correlation
is
5.6 percent.
The maximum deviation
is
8.3 percent.
The thermal conductivity based on this correlation exhibits
a
maximum
value of 65 watts per meter-K
at
about 1500 K.
Cooke estimates
a
maximum value of
about 78
watts
per meter-K
at
2033
K,
as
shown in figure 6.
Thermal conductivity
is
not easily calculated from equation (8),
so
equation (8) was
approximated with the following polynomial:
k
=
21.874
+
0.056255 T
-
1.8325XlO
-5
T
2
The maximum difference between thermal conductivity calculated with this equation and
that calculated from equation (8)
is
3 percent
at
800 K.
-
-
..
.
.
..
_.
____
,I
Vapor Pressure
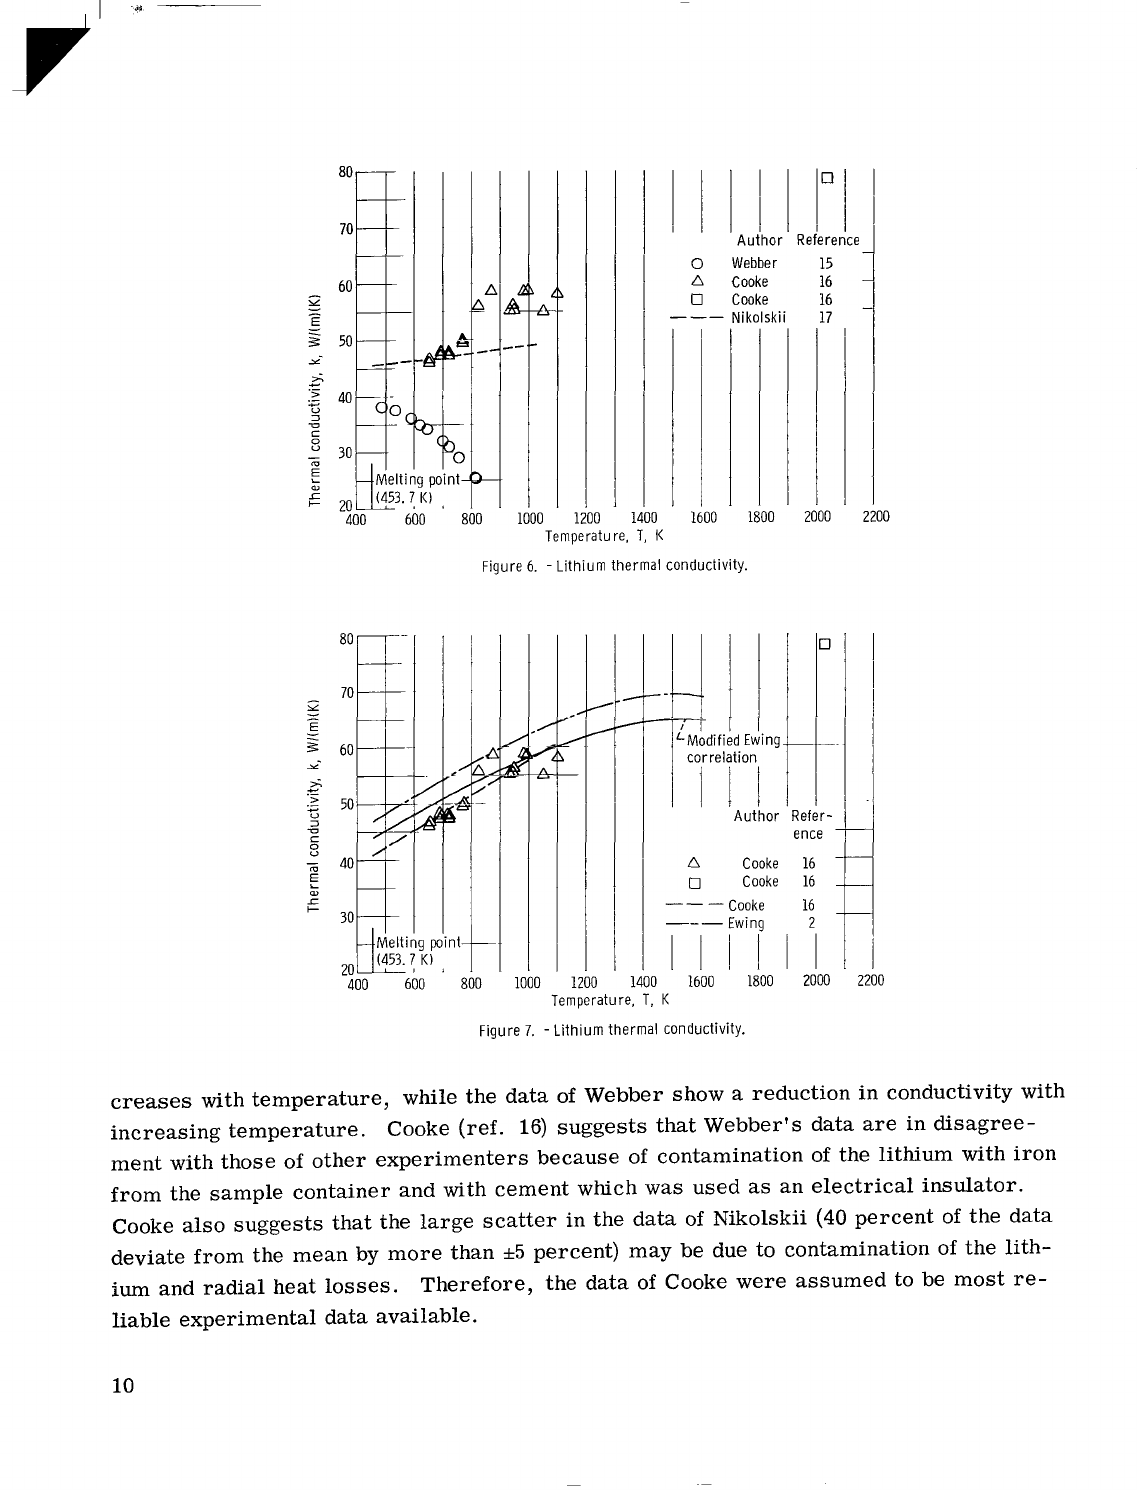
Experimental data relating the vapor pressure of liquid lithium
to
temperature
are
shown in
figure
8.
Hartmann and Schneider (ref.
19) measured the boiling temperatures
of lithium for various measured values of pressure. An inert atmosphere of argon was
used to control the pressure over the liquid lithium. Rigney
et
al.
(ref.
20),
measured
the pressure
with
a
bellows-activated pressure transmitter which was balanced by an
inert gas pressure. Rigney's data were obtained over
a
temperature range from about
1300 to
1800
K.
Achener and Fisher (ref. 21), used
a
'Pconstantvolume method" to
measure vapor pressures between 1300 and 1500
K.
The lithium was held in
a
sealed
capsule and the pressure was measured by balancing the internal capsule pressure
against
a
null-type diaphragm with an equal external pressure of an inert gas. Maucherat
(ref.
22)
determined vapor pressures between
800
and
900
K
by measuring the flow of an
atomic
jet
through an orifice.
The lithium
was
heated in
a
crucible under vacuum. A
stream of heated lithium
was
allowed to flow through an orifice for
a
measured time.
The vapor stream was condensed on
a
target, and the
total
quantity
of
lithium collected
was measured.
,.:
I
Author
ence
-
A
Hartmann
19
z
0
Rigney
20
-
0
Achener
21
-
1200
1400
1600
1800
Temperature,
T,
K
Figure
8.
-
Lithium vapor pressure
(log
P
=
10.015
-
8064.
SIT).
12

The vapor pressure data were correlated with the following equation:
log
P
=
10.015
-
8064.5
(9)
T
With
this
equation the data shown in figure 8 are correlated with
a
standard deviation of
*3.38 percent. The maximum deviation of -32.6 percent occurred
at
a
vapor pressure
of about 6 newtons per square meter.
The normal boiling point of lithium, calculated
from
equation (9),
is
1608*6
K.
This
agrees well with the boiling point (1609*5
K)
re-
ported in the Handbook of Chemistry and Physics
(ref.
23). Rigney reported (ref. 20)
a
boiling point of 16134
K,
while Hartmann and Schneider reported 1609*5
K.
Maucherat
extrapolated her vapor pressure data from 915
K
and reported
a
boiling point of 1530
K.
Viscosity
The viscosity of liquid lithium was measured by Andrade
(ref.
24), Novikov
(ref.
3),
Rigney et
al.
(ref. 25), Ban et
al.
(ref.
26), and Achener and Fisher (ref. 27), and the
data
are
shown in figure 9
as
a
function of temperature.
These experimenters
all
chose
Author Refer-
+'
I
I
TI
c
0
Rigney
t"
600
800
1200
I
1600
Temperature, T,
K
Figure
9.
-
Lithium viscosity
(log
I.I
=
-3.080
+
[57.63/T]
-
5.172~10-~
TI.
13
I
~
the oscillating sphere
(or
cylinder) viscometer method for measuring the liquid viscos-
ity.
The viscosity
is
determined by measuring the period and reduction in amplitude of
a
torsional pendulum containing the liquid lithium.
The reduction in amplitude
is
caused
by the viscous drag exerted by the lithium on the inside walls of the container.
The data
of Achener
are
about
25
percent higher than those of the other investigators. His only
explanation
for
the cause
of
this
discrepancy
is
the possible presence of impurities in
the lithium samples.
These data were correlated with the following equation:
57
63
-
5.172X10
-4
T
log
IJ.
=
-3.080
+A
T
Equation
(10)
correlates the data with
a
standard deviation of rt19 percent and
a
maximum
deviation of &29 percent.
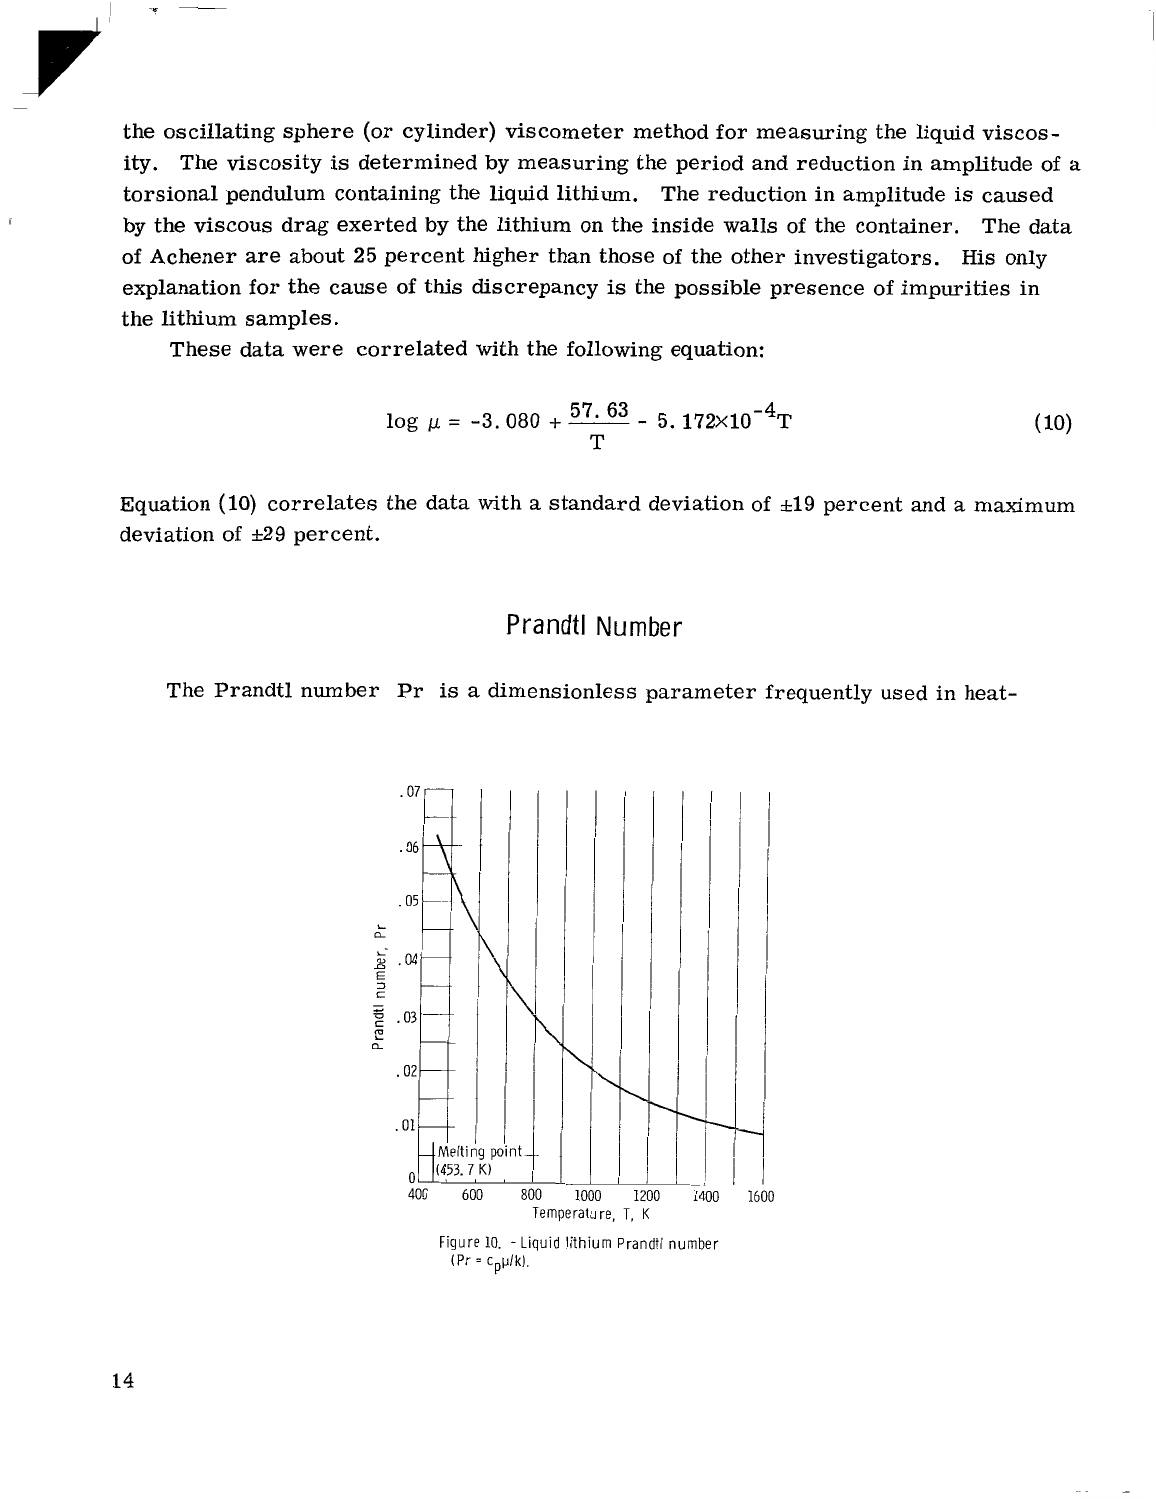
Prandtl
Number
The Prandtl number
Pr
is
a
dimensionless parameter frequently used in heat-
I
'\
c
5
.03
e
a
.01
Melting
pi
u-
400
600
8
1600
Temperature,
T,
K
Figure
10.
-Liquid lithium Prandtl number
(Pr
=
cplk).
14
transfer calculations.
The Prandtl number
is
defined
as
Pr
=
-
cPp
k
Values of the heat capacity, viscosity, and thermal conductivity are obtained from equa-
tions
(5), (lo),
and
(8)
and substituted into equation
(11).
The Prandtl number decreases
from
0.0612
at
the melting point to
0.00865
at
the normal boiling point.
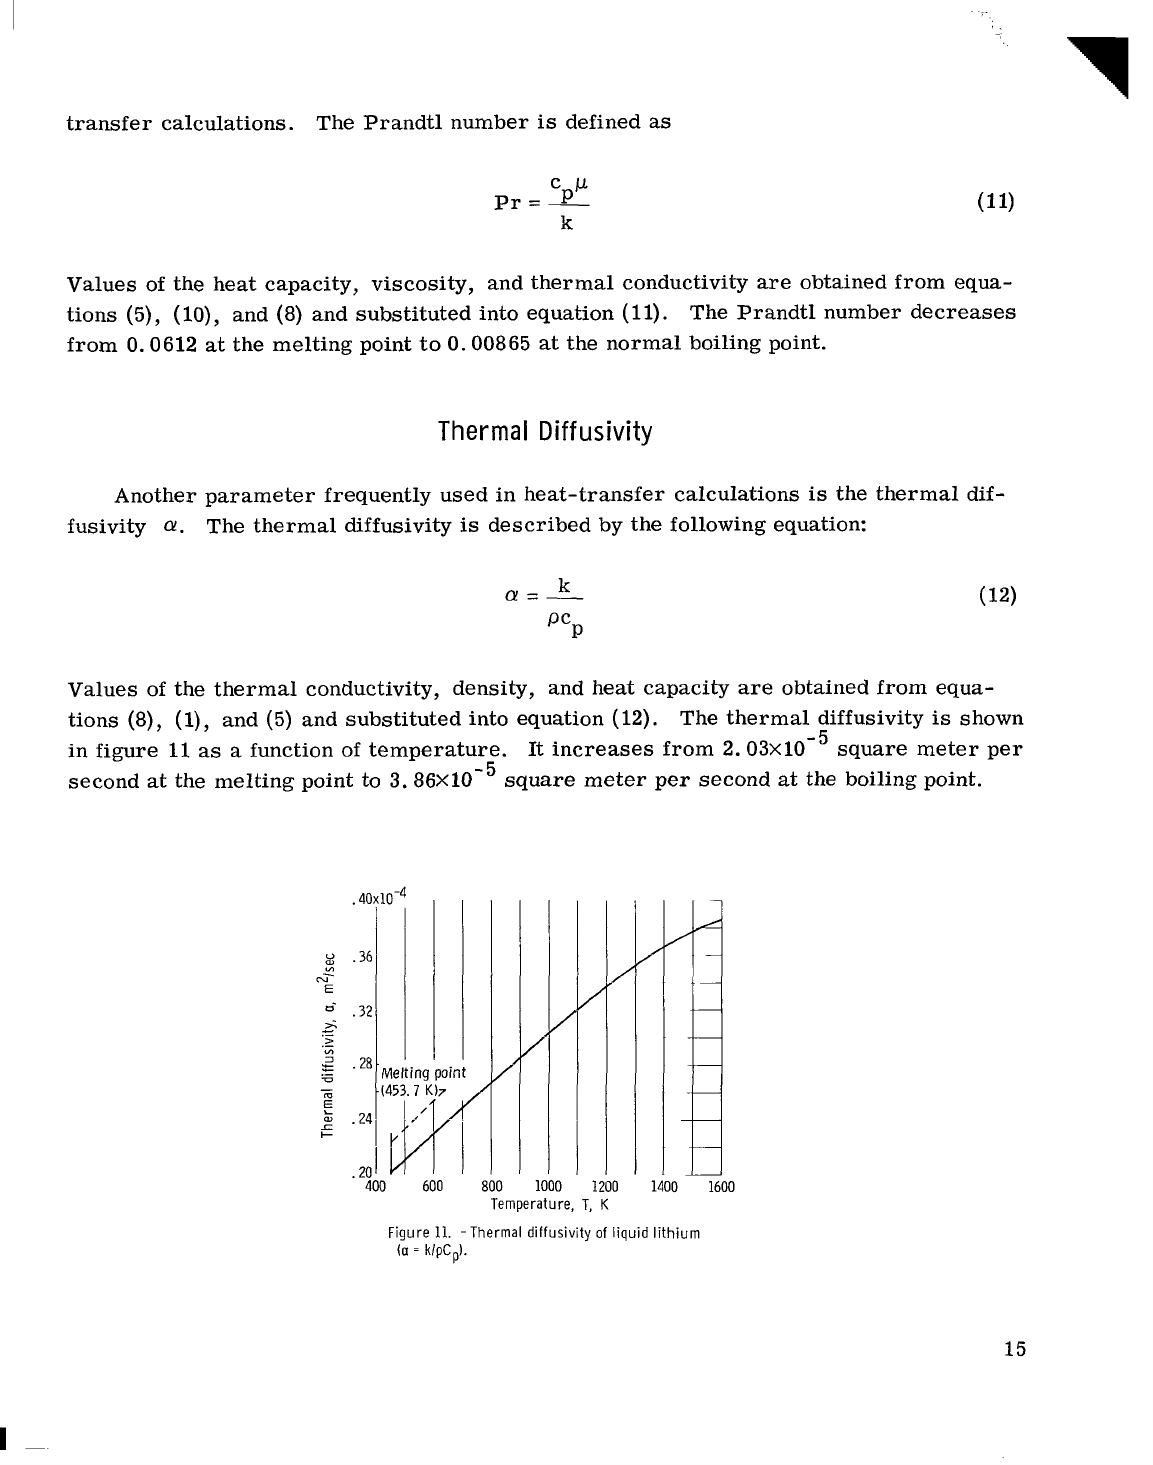
Thermal
Diffusivity
Another parameter frequently used in heat-transfer calculations
is
the thermal dif-
fusivity
a.
The thermal diffusivity
is
described by the following equation:
Values of the thermal conductivity, density, and heat capacity are obtained from equa-
tions
(8), (l),
and
(5)
and substituted into equation
(12).
The thermal diffusivity
is
shown
in figure
11
as
a
function of temperature.
It
increases from
2.03~10-~
square meter per
second at the melting point to
3.
square meter per second
at
the boiling point.
1200
1400
1600
Temperature, T,
K
Figure
11.
-Thermal
diffusivity
of
liquid
lithium
(a
=
klpCp).
15

CONCLUSIONS
Physical property data for liquid lithium have been empirically correlated
as
a
func-
tion
of
temperature. The density, electrical resistivity, enthalpy, surface tension, and
vapor pressure data have been correlated with standard deviations of 3.5 percent
or
less.
The normal boiling point, calculated from vapor pressure data,
is
1608*6 K.
The thermal conductivity data
are
in poor agreement. Thermal conductivity was
calculated
as
a
function of temperature based upon
a
modified Ewing correlation and the
empirically determined relations for electrical resistivity, density, and heat capacity.
The standard deviation between
this
correlation and the experimental data of Cooke
is
5.7 percent. The thermal conductivity exhibits
a
maximum value of about 65 watts per
meter-K
at
about 1500 K. The latent heat of fusion calculated from the enthalpy correla-
tion
is
4.
55x10 joules per kilogram.
5
Lewis Research Center,
National Aeronautics and Space Administration,
Cleveland, Ohio,
April
8, 1968,
120-27-06-17-22.
REFERENCES
1.
Lahti, Gerald
P.
;
Lantz, Edward and Miller, John
V.
:
Preliminary Considerations
for
Fast
Spectrum, Liquid-Metal Cooled Reactor Program
for
Space-Power Appli-
cations. NASA TN D-4315, 1967.
2. Ewing, C. T.; Walker,
B.
E.; Grand,
J.
A.; and Miller,
R.
R.: Thermal Conduc-
tivity of Metals. Chem. Eng. Prog. Sym. Ser., vol. 53, no.
20,
1957, pp. 19-24.
3. Novikov,
I.
I.;
Soloviev,
A.
N.;
Khabakhnasheva, E.
M.;
Gruzdev,
V.
A,;
Pridantzev,
A.
I.
;
and Vasenina,
M.
Ya.
:
The Heat-Transfer and High-
Temperature Properties of Liquid Alkali Metals.
J.
Nucl. Energy, vol. 4, no. 3,
pt.
II,
1957, pp. 387-408.
4.
Been,
S.
A.,
et
al.
:
The Densities
of
Liquids
at
Elevated Temperatures. Rep.
NEPA- 1585, Fairchild Engine and Airplane Corp.
,
Sept.
7,
1950.
5. Tepper,
F.;
Zelenak,
J.
S.;
Roehlich,
F.,
Jr.;
and May,
V.
B.: Thermophysical
and Transport Properties of Liquid Metals. MSA Research Corp. (AFML-TR-65-
99,
DE
No. AD-464138), May 1965.
6. Kapelner, Samuel
M.
:
The Electrical Resistivity of Lithium and Sodium and
Sodium-
Potassium Alloy. Rep. PWAC-349,
Pratt
&
Whitney Aircraft, June 30, 1961.
16
7.
Freedman,
J.
F.
;
and Robertson, W. D.
:
Elect ical Resistivity of Liquid Sodium,
Liquid Lithium, and Dilute Liquid Sodium Solutions.
Vol.
34, no.
1,
Mar.
1961,
pp. 769-780.
8. Douglas, Thomas B.
;
Dever, James L.
;
Epstein, Leo
F.
;
and Howland, William H.
:
The Heat Capacity of Lithium from 25O to 900'
C;
the Heat of Fusion and the Triple
Point; Thermodynamic Properties of the Solid and Liquid. Rep. 2879, National
Bureau of Standards, Oct. 16, 1953.
9.
Bates, A.
G.
;
and Smith, D.
J.
:
Specific Heat and Enthalpy of Liquid Lithium in the
Range of 500' C to 1000° C. Massachusetts Inst. Tech. (AEC Rep. K-729),
Mar.
28,
1951.
10. Cabbage,
A.
M.
:
Enthalpy, Mean Heat Capacity, and Absolute Heat Capacity of Solid
and Liquid Lithium. Rep. NEPA-1370, Fairchild Engine and Airplane Corp.
(AECD-3240), Mar. 31, 1950.
11.
Achener,
P.
Y.
;
and Fisher, D. L.
:
The Specific Heat
of
Liquid Sodium and
Lithium.
Vol.
6
of
Alkali Metals Evaluation Program. Rep. AGN-8191, vol. 6,
Aerojet-General Corp., June 1967.
12.
Kutateladze,
S. S.;
Borishanskii,
V.
M.;
Novikov,
I.
I.;
and Fedynskii,
0.
S.:
Liquid-Metal Heat Transfer Media. Supp. No.
2,
Soviet
J.
Atomic Energy, 1958.
13. Achener,
P.
Y.
:
Alkali Metals Evaluation Program.
Rep. AGN-8202, Aerojet-
General Corp.
,
Nov. 1966.
14. Taylor,
J.
W.
:
The Surface Energies
of
the Alkali Metals.
Phil.
Mag., vol. 46,
Aug. 1955, pp. 867-876.
15. Webber, Henry
A.
;
Goldstein, David; and Fellinger, Robert C.
:
Determination of
the Thermal Conductivity
of
Lithium. Trans. ASME,
vol.
77,
no.
2,
Feb. 1955,
pp. 97-102.
16. Cooke,
J.
W.
:
Experimental Determination
of
the Thermal Conductivity
of
Molten
Lithium from 320Oto 830' C.
J.
Chem. Phys., vol. 40, no. 7, Apr.
1,
1964,
pp. 1902-1909.
17. Mikheev, M.
A.,
ed.
:
Problems of Heat Transfer. Rep. AEC-Tr-4511, Jan. 1962,
pp.
1-11.
18. Sommerfeld,
A.
:
The Electron Theory
of
Metals Based on Fermi Statistics.
Z.
Physik, vol. 47,
Feb.
7, 1928, pp. 1-32.
19. Hartmann, H.
;
and Schneider, R.
:
Boiling Temperatures of Magnesium, Calcium,
Strontium, Barium and Lithium.
2.
Anorg. Allgem. Chem., vol. 180, 1929,
pp. 275-283.
17
20. Rigney, D. V.
;
Kapelner,
S.
M.
;
and Cleary, R.
E.
:
The Vapor
Pressure
of Lith-
ium between 1307 and 1806-K. Rep. TIM-844,
Pratt
&
Whitney Aircraft,
Sept. 1965.
21. Achener,
P.
Y.
;
and Fisher,
D.
L.:
The Vapor Pressure of Lithium. Vol. 2
of
Alkali Metals Evaluation Program. Rep. AGN-8191, vol. 2,. Aerojet-General
Corp.
,
July 1967.
22. Maucherat, Marguerite: Vapor
Pressure
of Lithium between 462' and 642'.
Rep.
AEC-TR-2012, 1953.
23. Hodgman, C.
D.
,
ed.
:
Handbook
of
Chemistry and Physics. Chemical Rubber
Publishing
Co.
,
1955.
24. Andrade, E. N. da
C.
;
and Dobbs, E. R.
:
The Viscosities of Liquid Lithium,
Rubidium and Caesium. Proc. Roy. SOC.
,
Ser. A, vol.
211,
no. 1104,
Feb.
7, 1952, pp. 12-30.
25. Rigney,
D.
V.; Kapelner,
S.
M.; and Cleary, R. E.: The Viscosity
of
Lithium.
Rep. TIM-849,
Pratt
&
Whitney
Aircraft,
July 1965.
26.
Ban, N.
T.
;
Randall, C. M.
;
and Montgomery,
D.
J.
:
Effect
of
Isotopic Mass on
Viscosity of Molten Lithium. Phys. Rev., vol. 128, no.
1,
Oct.
1,
1962,
pp. 6-11.
27. Achener,
P.
Y.
;
and Fisher, D.
L.
:
Viscosity
of
Liquid Sodium and Lithium.
Vol. 5
of
Alkali Metals Evaluation Program. Rep. AGN-8191, Vol. 5, Aerojet-
General Corp.
,
May 1967.
BIBLIOGRAPHY
Bernini,
A.
;
and Cantoni, C.
:
Thermal Expansion
of
Sodium, Potassium, and Lithium.
Nuovo Cimento, vol.
8,
Oct. 1914, pp. 241-260.
Bogros,
A.
:
Physical Properties
of
Lithium Vapour. Ann. de Physique, vol. 17,
Mar. 1932, pp. 199-282.
Burdi, G.
F.
:
SNAP Technology Handbook. Vol.
1,
Liquid Metals. Rep. NAA-SR-
8617, Atomics International, Aug.
1,
1964.
Chapman, Thomas
W.
:
The Viscosity of Liquid Metals. Rep. UCRL-11930, Lawrence
Radiation Lab., Univ. California, Feb. 15, 1965.
Crane, N.
T.
:
Physical and Thermodynamic Properties of Lithium.
Rep. FXM-4986,
Pratt
&
Whitney Aircraft, Jan. 19, 1961.
18
Ditchburn, R. W.; and Gilmour,
J.
C.
:
The Vapor Pressures of Monatomic Vapors.
Rev. Mod. Phys., vol. 13, no. 4, Oct. 1941, pp. 310-327.
Dushman, Saul:
Scientific Foundations of Vacuum Technique. John Wiley
&
Sons, Inc.,
1949.
Ellis,
J.
F.
:
A Data Sheet for Lithium. Rep. RDB(CA)/TN-154, United Kingdom
Atomic Energy Authority, 1958.
Evans, William H.
;
Jacobson, Rosemary; Munson, Thomas R.
;
and Wayman, Donald
D.:
Thermodynamic Properties
of
the Alkali Metals.
J.
Res. National Bur. Standards,
vol. 55, no. 2, Aug. 1955, pp. 83-96.
Fenn,
E.
M.
:
The Physical Properties of Lithium. Lithium Corp. of America, Inc.
Grosse, Aristid V.
:
Thermal Conductivity of Liquid Metals Over Their Entire Liquid
Range. Temple Univ. (AEC Rep. TID-21737), Dec. 7, 1964.
Hicks, W.
T.
:
Evaluation of Vapor-Pressure Data for Mercury, Lithium, Sodium, and
Potassium.
J.
Chem. Phys. vol. 38, no. 8, Apr. 15, 1963, pp. 1873-1880.
Hultgren, Ralph; et
al:
Selected Values
of
Thermodynamic Properties of Metals and
Alloys. John Wiley
&
Sons,
Inc., 1963.
Jackson, C. B.
;
and Lyon, Richard N., eds: Liquid Metals Handbook.
Rep. NAVEXOS-
P-733 (Rev.), -AEC and
Office
of Naval Research, June 1952.
Kelley,
K.
K.
:
Contributions to the Data on Theoretical Metallurgy.
ID.
The
Free
Energies of Vaporization and Vapor Pressures of Inorganic Substances. Bull.
No. 383, Bureau of Mines, 1935.
Loftness, R. L.
:
A
Vapor Pressure Chart for Metals. Rep. NAA-SR-132, North
American Aviation, Inc., June
1,
1951.
Lorenz,
L.
:
The Conductivity
of
Metals for Heat and Electricity. Ann. d. Physik,
vol. 13, no. 20, 1881, pp. 422-447.
Meisl,
C.
J.
;
and Shapiro, A.
:
Thermodynamic Properties of Alkali Metal Vapors and
Mercury.
Rep. 60FPD358-A, 2nd ed., General Electric Co., Nov.
9, 1960.
Rudnev, I.
I.
;
Lyashenko, V.
S.
;
and Abramovich, M.
D.
:
Thermal Conductivity of
Sodium and Lithium. Atomnaya Energ., vol.
11,
Sept. 1961, pp. 230-233.
Samuel,
W.
A.
;
Ciarlariello,
T.
A.
;
and Shearer, R.
E.
:
Research and Development
of Lithium and Lithium Hydride Propellant Feed Systems for Electric Propulsion
Systems. Rep. MSAR-62-60, MSA Research Corp. (NASA CR-52753),
June 27, 1962.
19
II I
!!I!(
IU
Stull, Daniel R.
;
and Sinke, Gerald C.
:
Thermodynamic Properties of the Elements.
Am. Chem. SOC., 1956.
Weatherford, W. D.,
Jr.
;
Tyler, John C.
;
and Ku,
P.
M.
:
Properties
of
Inorganic
Energy-Conversion and Heat-Transfer Fluids for Space Application. Southwest
Research Inst. (WADD-TR-61-96), Nov. 1961.
Wiedemann,
G.
;
and Franz, R.
:
The Thermal Conductivities of Metals.
Ann. d.
Physik, vol. 89, 1853, pp. 497-531.
Yaggee,
F.
L.
;
and Untermyer, Samuel: The Relative Thermal Conductivities of Liquid
Lithium, Sodium, and Eutectic NaK, and the Specific Heat of Liquid Lithium. Rep.
ANL-4458, Argonne National Lab., Apr. 21, 1950.
20
NASA-Langley,
1968
-
17
E-4304
1
ATIONAL AERONAUTICS AND
SPACE
ADMINISTRATION
I“
POSTAGE
AND
FEES PAID
WASHINGTON,
D.
C.
20546
NATIONAL AERONAUTICS AND
SPACE ADMINISTRATION
FIRST
CLASS
MAIL
OFFICIAL BUSINESS
mSTMASTER:
‘The aeronautical and space activities of the United States shall be
conducted
so
us
to
contribute
. .
.
to
the expansion
of
haman
knowl-
edge
of
phenonienu
in
the utmosphere and space. The Administration
shall provide
for
the widest practicable and appropriate dissemination
of information concerning
its
activities and the resalts thereof.”
-NATIONAL
AERONAUTICS
AND
SPACE ACT
OF
1958
If
Undeliverable
(Section
158
Postal Manual)
Do
Not
Return
NASA SCIENTIFIC
AND
TECHNICAL PUBLICATIONS
TECHNICAL REPORTS: Scientific and
technical information considered important,
complete, and a lasting contribution to existing
knowledge.
TECHNICAL NOTES: Information less broad
in scope but nevertheless of importance as a
contribution
to
existing knowledge.
TECHNICAL MEMORANDUMS
:
Information receiving limited distribution
because
of
preliminary data, security classifica-
tion, or other reasons.
CONTRACTOR
REPORTS: Scientific and
technical information generated under a NASA
contracr or grant and considered an important
contribution
to
existing knowledge.
TECHNICAL TRANSLATIONS: Information
published in a foreign language considered
to
merit NASA distribution in English.
SPECIAL PUBLICATIONS: Information
derived from
or
of
value to NASA activities.
Publications include conference proceedings,
monographs, data compilations, handbooks,
sourcebooks, and special bibliographies.
TECHNOLOGY UTILIZATION
PUBLICATIONS: Information
on
technology
used by NASA that may be of particular
interest in commercial and other non-aerospace
applications. Publications include Tech Briefs,
Technology Utilization Reports and Notes,
and Technology Surveys.
Details
on
the availability of these publications may
be
obtained from:
SCIENTIFIC AND TECHNICAL INFORMATION
DIVISION
NATIONAL AERONAUTICS AND SPACE ADMINISTRATION
Washington,
D.C.
PO546
